
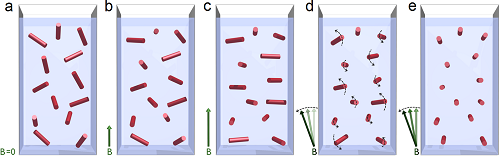
Figure 3: Model of magnetic alignment of hemozoin crystals in a dilute suspension. Red bars represent the magnetic hard axis of the crystals.
High-sensitivity diagnosis of malaria via magnetically induced linear dichroism
Figure 3: Model of magnetic alignment of hemozoin crystals in a dilute suspension. Red bars represent the magnetic hard axis of the crystals.